
We are Nexus Energy Group Ltd. located in Toledo Ohio. The new legislation to provide a trillion dollar build-out of renewable energy infrastructure by 2030 has created incentives to go solar, buy an Electric Vehicle (EV) , the need for 500000 new EV charging stations and many other alternative energy options to wean America off of fossil fuel. Please call or email us for more information.
The Full Cost Structure of Commercial Electricity
Understanding the complete breakdown of your electricity costs is essential for identifying where savings opportunities exist. While your bill may not explicitly categorize charges this way, commercial electricity rates comprise several distinct components that reflect the journey electricity takes from generation to your facility.
These components include the cost of producing electricity, transporting it across high-voltage transmission lines, distributing it through local networks, and providing customer services and demand management. Each component contributes to your overall rate and can be impacted differently by energy efficiency measures and solar investments.
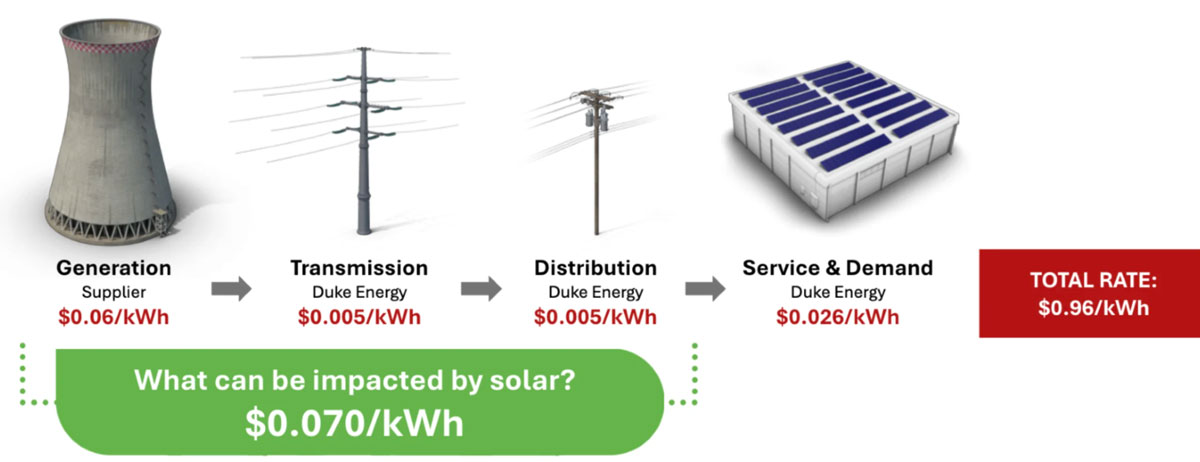 As shown in the image, your total electricity rate (e.g., $0.96/kWh) typically includes:
- Generation: The cost of producing electricity at power plants ($0.06/kWh)
- Transmission: Moving electricity from generation facilities to local areas ($0.005/kWh)
- Distribution: Delivering electricity through local infrastructure ($0.005/kWh)
- Service & Demand: Customer service and peak demand charges ($0.026/kWh)
- Legislation: has been passed enforcing rates to double over the next by 2027
How Solar Power Transforms Your Electric Bill
Solar power systems impact different components of your bill in distinct ways:
Impact on Usage (kWh) Charges
Solar directly reduces the grid electricity you purchase, lowering usage charges proportionally to your solar production. With net metering, excess production earns credits on your bill. When a business installs solar, their bill shows:
- kWh Delivered: Electricity drawn from the grid
- kWh Received: Excess solar electricity sent back to the grid
- Net kWh: The difference (what you’re billed for)
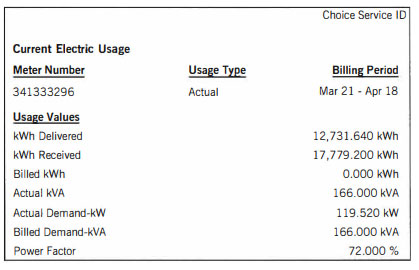 In the example, the business generated enough solar electricity to reduce their billed kWh to zero.
Impact on Demand Charges
Solar can help reduce demand charges, but the impact depends on:
- System size relative to your facility’s needs
- Alignment between solar production hours and your peak demand periods
- Weather patterns and seasonal variations
In most cases, solar installations will lower your demand charges, but the reduction may not be proportional to the energy savings.
Net Metering Benefits
With net metering, excess electricity your solar system produces during high-production periods earns credits that offset consumption during low-production periods. This arrangement can create significant savings. In optimal situations, businesses may pay nothing for energy during certain months and even accumulate credits that roll over to future billing periods.
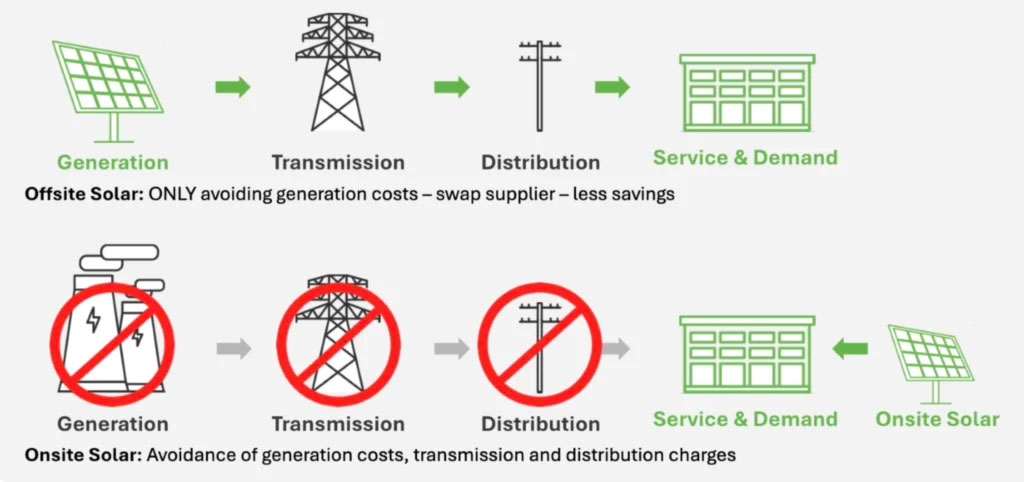
Onsite vs. Offsite Solar: Different Savings Profiles
The Melink Solar presentation distinguishes between:
- Onsite Solar: Systems installed at your facility offset generation costs by reducing purchased electricity ($0.070/kWh impact in the example).
- Offsite Solar: Remote installations can potentially offset generation, transmission, and distribution charges through different compensation structures.
Strategic Bill Optimization Approaches
For Usage (kWh) Reduction
- Energy-efficient lighting and equipment upgrades
- Building automation and controls
- Operational scheduling to minimize unnecessary consumption
- Solar power generation to offset purchased electricity
For Demand (kW) Management:
- Staggered equipment startup to avoid simultaneous power draws
- Load shifting to more evenly distribute energy use
- Battery storage systems to discharge during peak demand periods
- Solar + storage solutions to reduce both usage and demand charges
Analyzing Your Bill for Solar Potential
Before investing in solar, perform these analyses:
- Calculate your effective rate: Divide total bill by total kWh
- Identify peak demand periods: Determine if they align with solar production
- Review your rate structure: Understand how time-of-use factors impact solar savings
- Analyze your load profile: Match solar system size to your consumption patterns
- Evaluate net metering policies: Verify your utility’s compensation for excess generation
Taking Control of Your Energy Future Understanding your commercial electric bill empowers you to make strategic energy decisions. For many businesses, solar power transforms energy from a fixed expense into a controllable asset—providing price stability, reducing operating costs, and advancing sustainability goals simultaneously.
What a Successful Solar Bill Might Look Like
| BILLING ITEM | BEFORE SOLAR | AFTER SOLAR |
| kWh Used | 12,000 | 4,500 |
| kWh from Solar | 0 | 8,000 |
| Net kWh Billed | 12,000 | 500 |
| Demand Charge | $1,500 | $1,400 |
| Energy Charge | $1,800 | $50 |
| Total Bill | $3,300 | $1,450 (or less with credits!) |
For a personalized analysis of how solar can optimize your specific electric bill, contact our team of commercial solar experts today.